Metrics 
There are metrics that are going to be of interest both in the infrastructure itself (CPU, Memory, disk) and also on application level (amount of non 200 responses, latency, % of errors) and we will have two key sources for this: Prometheus and AWS CloudWatch metrics.
Metric collectors
 CloudWatch metrics: Is where amazon stores a great number of default metrics for each of its services. Useful
data here can be interpreted and alerts can be generated with Cloudwatch alerts and can also be used as a source for
Grafana. Although this is a very good offering, we have found it to be incomplete and highly bound to AWS services but
not integrated enough with the rest of the ecosystem.
CloudWatch metrics: Is where amazon stores a great number of default metrics for each of its services. Useful
data here can be interpreted and alerts can be generated with Cloudwatch alerts and can also be used as a source for
Grafana. Although this is a very good offering, we have found it to be incomplete and highly bound to AWS services but
not integrated enough with the rest of the ecosystem.- Prometheus: This is an open source tool (by Soundcloud) that is essentially a time-series database. It stores
metrics, and it has the advantage of being highly integrated with all Kubernetes things. In fact, Kubernetes is already
publishing various metrics in Prometheus format “out of the box”. It’s alerting capabilities are also remarkable, and it
can all be kept as code in a repository. It has a big community behind it, and it’s not far fetched at this point to
include a library in your own application that provides you with the ability to create an endpoint that publishes
certain metrics about your own application, that we can graph or alert based on them.

Graphing metrics
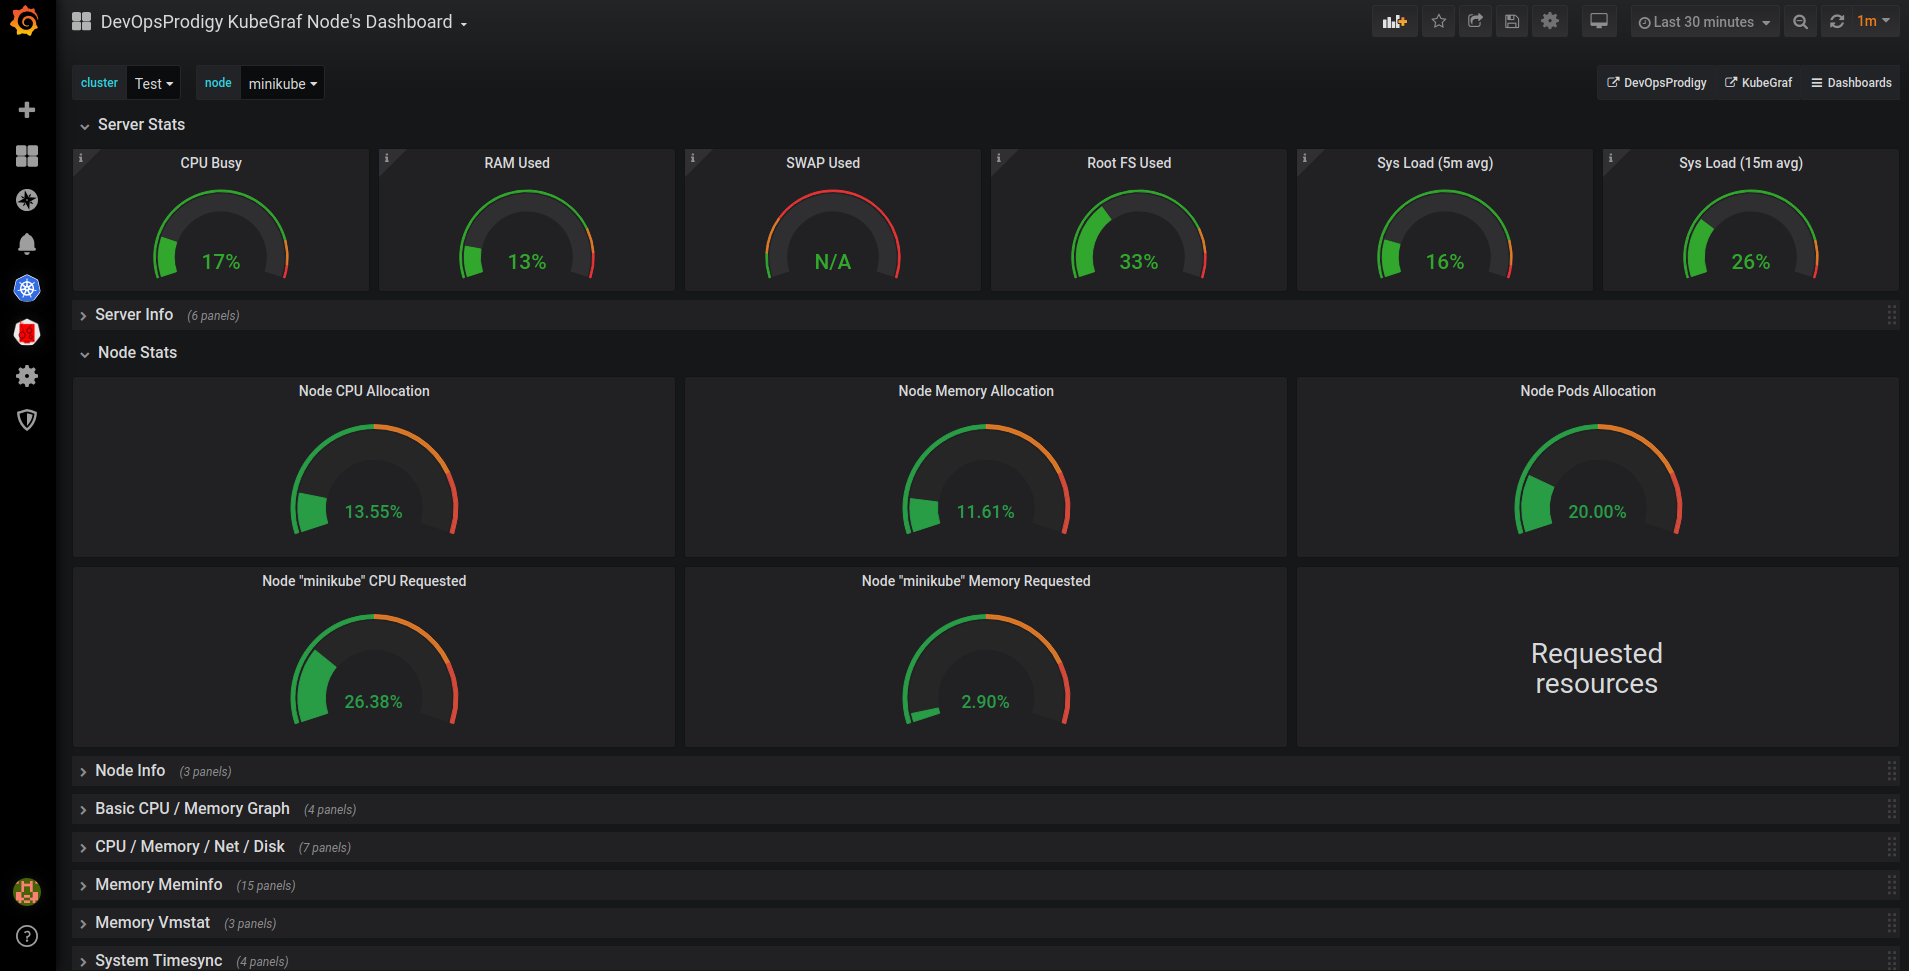
Grafana is the standard open source visualization tool which can be used on top of a variety of different data stores. It can use prometheus as a source, and there are many open source dashboards and plugins available that provide great visualization of how things are running, and we can also build our own if necessary. If something is left out of prometheus and already available in Cloudwatch metrics we can easily integrate it as a source for Grafana as well, and build dashboards that integrate these metrics and even do some intelligence on them coming from multiple origins.

Alerting based on metrics
Although Grafana already has alerting capabilities built in, we rather (most of the times) have Prometheus alerting engine configured, because we can have really customize and specify alerts. We can have them as code in their extremely readable syntax. Example:
