Logs 
Overview 
Centralized Logs Solution
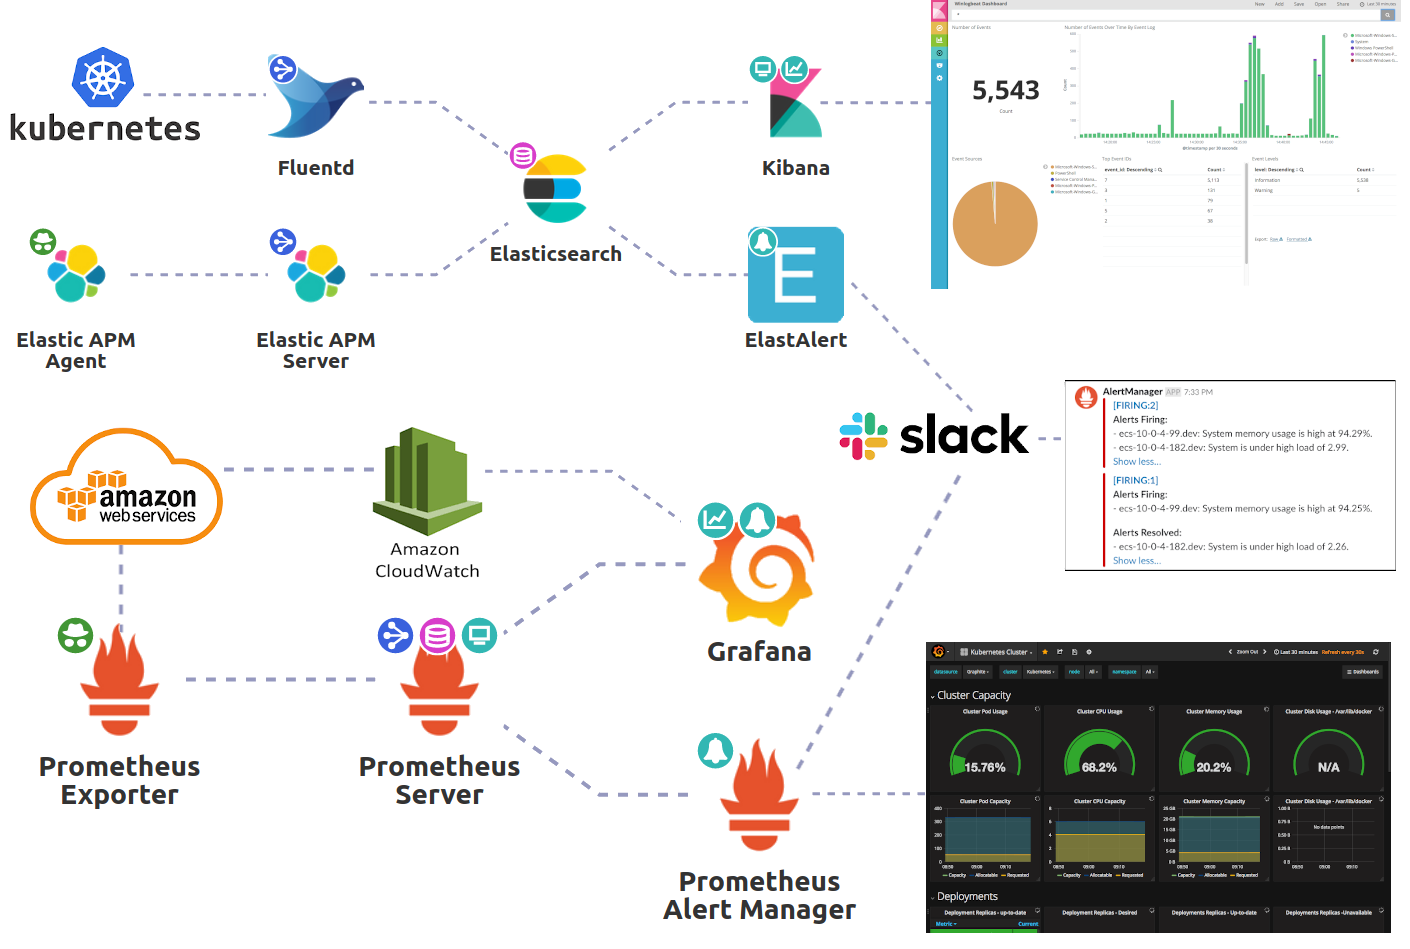
For this purpose we propose the usage of Elasticsearch + Kibana for database and visualization respectively. By deploying the Fluentd daemonset on the Kubernetes clusters we can send all logs from running pods to Elasticsearch, and with ‘beat’ we can send specific logs for resources outside of Kubernetes. There will be many components across the environment generating different types of logs: ALB access logs, s3 access logs, cloudfront access logs, application request logs, application error logs. Access logs on AWS based resources can be stored in a centralized bucket for that purpose, on the security account and given the need these can be streamed to Elasticsearch as well if needed.

Alerting based on Logs
Certain features that were only available under licence were recently made available by Elastic, and included in the open source project of Elasticsearch. Elastalert allow us to generate alerts based on certain log entries or even after counting a certain amount of a type of entry, providing great flexibility.
--
Alternatives Comparison Table 
Leverage Confluence Documentation
You'll find here a detailed comparison table between EC2 Self-hosted and AWS ElasticSearch Elastic-Kibana Stack.